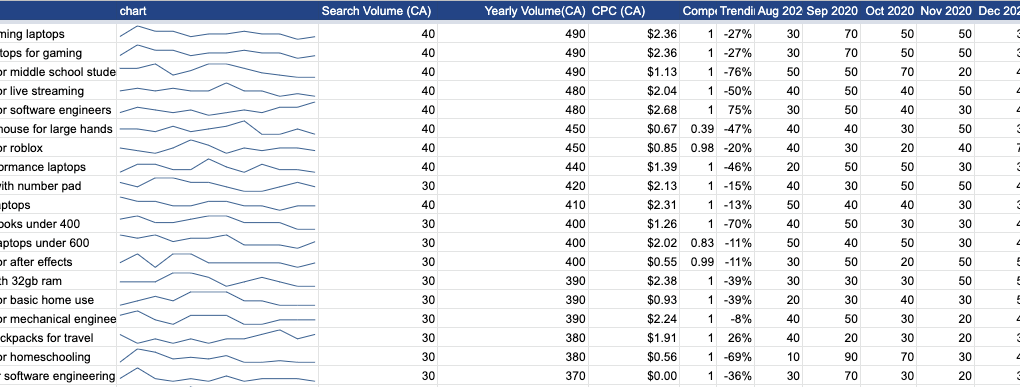
In SEO Data is key, and understanding search trend is important. I found a cool trick and made an excel that simplifies trend visualization. The data is the following sheet is pulled from keywords everywhere.
Unlike semrush or ahrefs, keywords everywhere give data of the last 12 months and one can run visualization on this to make better keyword selection decisions.
Importance of the following sheet
- Easy to understand the trend
- Prioritise months before it goes high
- Can be used to quick overview than crunching whole data
- Doesn’t Require whole plugin
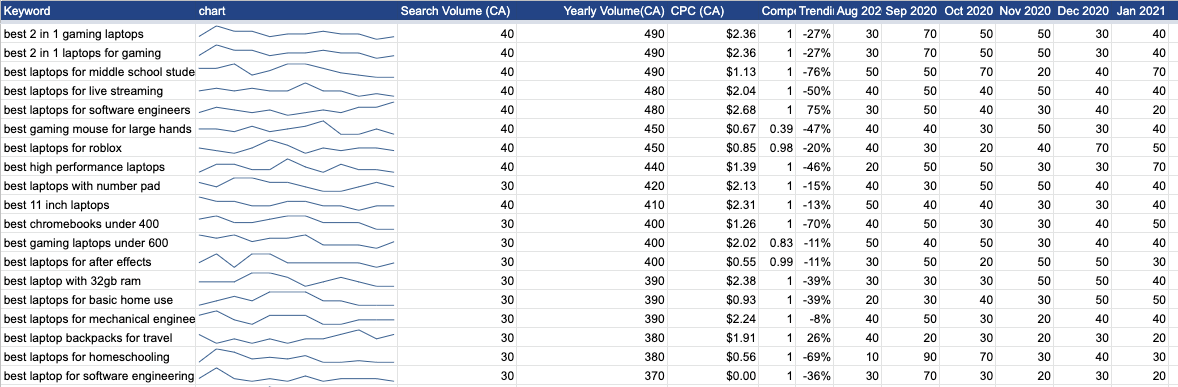
Formullar used:
Paste the following formula in the column you want to put the line chart in.
=SPARKLINE(H97:S97, {“column”,”bar”})
Customize the H97:S97 to anything in a row. In this case, I passed 12 months of data.
Do you want a sample sheet to be made for this? Just commend me, and I will make one and share you.